Adding Data Types To PivotTables
Many business professionals consider PivotTables one of Excel’s most powerful features, if not its’ most powerful feature. Although not as widely used as PivotTables, Excel’s Data Types are coming into their own as a feature. Importantly, you can use Data Types to incorporate “live” data into summaries and analyses, including those based on PivotTables. In this article, you will learn how to integrate data provided by Data Types into your PivotTables to elevate your Excel-based reports to even higher levels.
Understanding Data Types
When your computer is connected to the Internet, you can access Data Types to integrate external data into your Excel workbooks, analyses, and reports, including PivotTables. Specifically, the data available using Data Types includes geographic data, stock market data, and foreign currency exchange rate data. To access the power of Data Types, select a column of data in a range or table and click the Data Type you wish to use – Organization, Stocks, Currencies, or Geography.
To illustrate, consider the table pictured in Figure 1. Next, you will notice a “map-like” icon (known as a “card”) to the left of each of the states’ names. Clicking on the card lets you view or link data to your spreadsheet. The type of data you can link from a card varies based on the Data Type in use. For instance, creating a Stock data type facilitates linking information such as Current Price, Closing Price, and P/E Multiple.
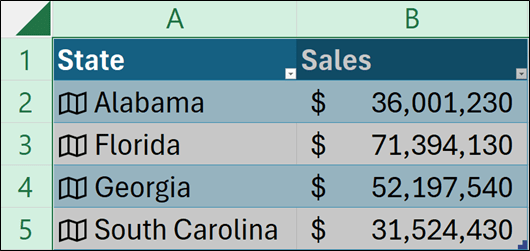
In the example presented, because the Data Type used is Geography, data such as Population, Number of Households, and Median Household Income are accessible. Notably, you can use the data you link from a card as you would any other data in Excel.
A Specific Example
To illustrate the power of Data Types used in PivotTables, let us click a card in the table pictured in Figure 1 and add Population and Median household income to the table, as shown in Figure 2.
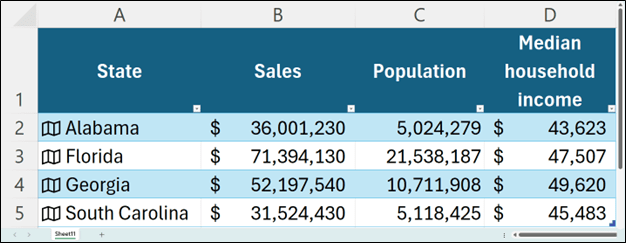
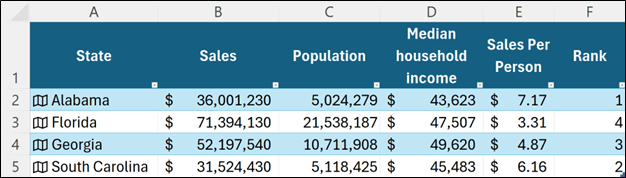
Next, with the two data fields added from the Data Type, let’s now use that data to create two user-defined calculations. The first calculation – Sales Per Person – is created by dividing Sales by Population. The second calculation uses Excel’s RANK function to identify the relative ranking of sales performance in each state.
Summary
Undoubtedly, you could perform manual research to locate the population of each of the four states under consideration and the median household income of each state. However, by taking advantage of Excel’s Data Types feature, we completed the analysis quickly and easily. Further, because the data coming from the Data Types is linked to Excel – not copied and pasted – our analysis is dynamic in nature. Thus, as the data from the Data Type changes, it will update in Excel and so too will all the calculations.
At K2 Enterprises, our commitment lies in providing unwavering support and expert instruction to CPAs. Explore the wealth of resources on our website, where you’ll find valuable insights on selecting the most suitable accounting software, ensuring your firm is equipped with the right tools for the journey ahead. K2 Enterprises provides continuing education programs to enhance your skills and credentials. Visit us at k2e.com, where we make sophisticated technology understandable to anyone through our conferences, seminars, or on-demand courses.